Solution Practice Set 6
We'll cover the following
Solution Practice Set 6#
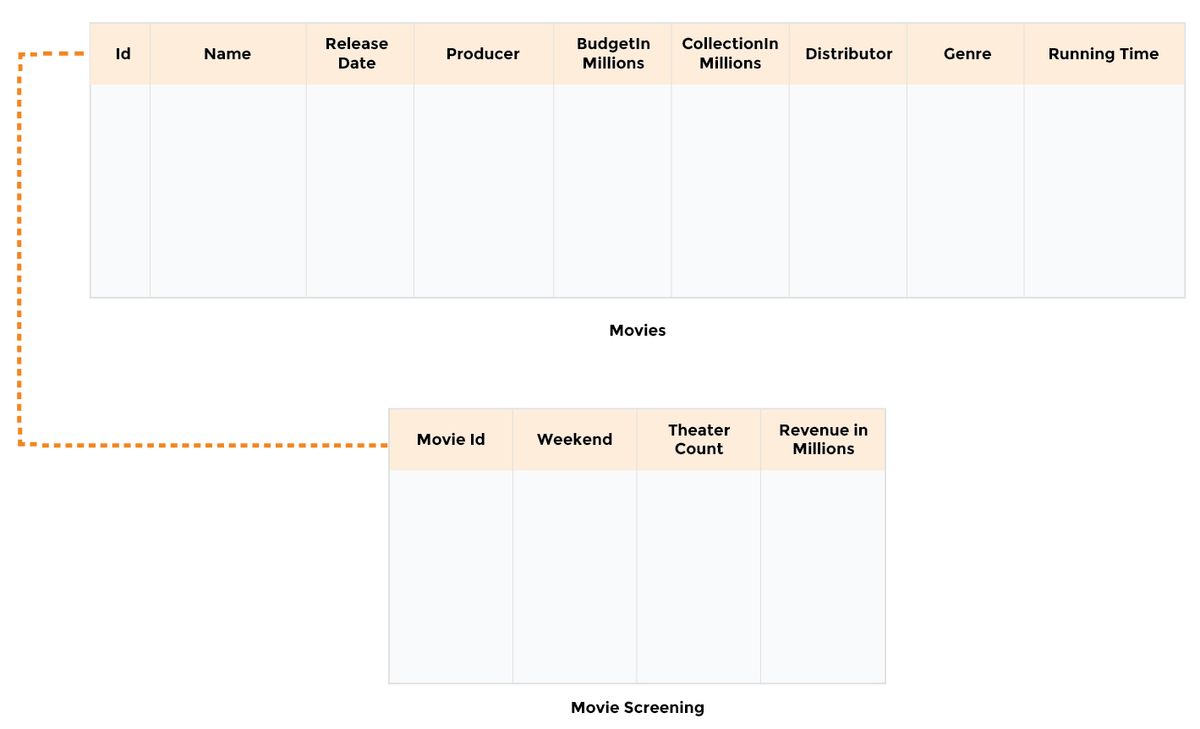
The database relationship model is reprinted below for reference.
Connect to the terminal below by clicking in the widget. Once connected, the command line prompt will show up. Enter or copy and paste the command ./DataJek/Lessons/quiz2.sh and wait for the MySQL prompt to start-up.
Question # 1#
Find the top two movies of distributors who have more than one movie to their name.
First we’ll check our Movies table for information on Distributors:
SELECT Distributor, COUNT(Id) FROM Movies
GROUP BY Distributor
HAVING COUNT(Id) > 1
ORDER BY 2 DESC;
We have two distributors with more than one movie in our table; Paramount Pictures and Warner Bros with three movies each.
Next we will find the movies of these distributors. We need to join the results of the previous query with the Movies table:
SELECT y.Distributor, y.Name, y.CollectionInMillions
FROM (
      SELECT Distributor, COUNT(Id)
      FROM Movies
      GROUP BY Distributor
      HAVING COUNT(Id) > 1
      ORDER BY 2 DESC
     ) AS x
INNER JOIN Movies y
ON y.Distributor = x.Distributor;
This query lists all the movies from distributors who meet our criterion of having more than one movie in the table. We are a step closer to finding the top two movies of each distributor.
Now we need ORDER BY clause to put the results in order according to CollectionInMillions:
SELECT y.Distributor, y.Name, y.CollectionInMillions
FROM (
      SELECT Distributor, COUNT(Id)
      FROM Movies
      GROUP BY Distributor
      HAVING COUNT(Id) > 1
      ORDER BY 2 DESC
     ) AS x
INNER JOIN Movies y
ON y.Distributor = x.Distributor
ORDER BY y.Distributor, y.CollectionInMillions DESC;
To find the top two movies, we need to rank the rows returned by the previous query. For older versions of MySQL which do not support the ROW_NUMBER() function, it can be emulated using session variables.
The @current_dist variable is updated in each iteration as @current_dist := y.Distributor AS dummy. The variable @dist_rank is incremented if @current_dist is the same, otherwise it is reset to 1.
@dist_rank := IF( @current_dist = y.Distributor, @dist_rank + 1, 1)
We will initialize the session variables and use them in the previously created query as follows:
SET @dist_rank := 0, @current_dist := '';

SELECT y.Distributor, y.Name, y.CollectionInMillions,
       @dist_rank := IF(@current_dist = y.Distributor, @dist_rank + 1, 1) AS distributor_rank,
       @current_dist := y.Distributor AS dummy
FROM (
      SELECT Distributor, COUNT(Id)
      FROM Movies
      GROUP BY Distributor
      HAVING COUNT(Id) > 1
      ORDER BY 2 DESC
     ) AS x
INNER JOIN Movies y
ON y.Distributor = x.Distributor
ORDER BY y.Distributor, y.CollectionInMillions DESC;
Two more columns are added to the result set and we have now numbered the rows.
The last step is selecting the top 2 rows based on the ranking. We will use the above query as a subquery:
SELECT Distributor, Name AS Movie,
       CollectionInMillions, distributor_rank AS Rank
FROM (
      SELECT y.Distributor, y.Name, y.CollectionInMillions,
      @dist_rank := IF(@current_dist = y.Distributor, @dist_rank + 1, 1) AS distributor_rank,
      @current_dist := y.Distributor AS dummy
      FROM (
            SELECT Distributor, COUNT(Id)
            FROM Movies
            GROUP BY Distributor
            HAVING COUNT(Id) > 1
            ORDER BY 2 DESC
           ) AS x
      INNER JOIN Movies y
      ON y.Distributor = x.Distributor
      ORDER BY y.Distributor, y.CollectionInMillions DESC
    ) as z
WHERE distributor_rank <= 2;
This is not the most optimal query because of the number of sub-queries and joins but it serves our purpose of dynamically selecting groups with more than one entry in the table and then finding the top two rows from those groups. A much cleaner and better performing query uses UNION as follows:
(
  SELECT Distributor,  Name AS Movie, CollectionInMillions
  FROM   Movies
  WHERE  Distributor = 'Paramount Pictures'
  ORDER BY CollectionInMillions DESC
  LIMIT 2
)
UNION
(
  SELECT Distributor,  Name AS Movie, CollectionInMillions
  FROM   Movies
  WHERE  Distributor = 'Warner Bros'
  ORDER BY CollectionInMillions DESC
  LIMIT 2
);
Here we are ordering the movies according to their CollectionInMillions and then limiting those results to top two. UNION then combines all the results. The drawback with this query is that we have to manually specify the Distributors we want in the result set. This is not a problem with only two distributors but it’s not hard to imagine what will happen if the number of distributors who meet our criterion is large.
Using the analytic ROW_NUMBER() function, this question can be solved without using any session variables. The sub-query in our solution becomes:
SELECT Distributor,  Name AS Movie, CollectionInMillions,
       ROW_NUMBER() OVER(PARTITION BY Distributor ORDER BY RevenueInMillions DESC) AS movie_rank
FROM   Movies
The above query will return the Movies tables numbered according to distributors. Next step is to select only those who have more than one movie to their credit. We will join the results of the query above with the one we created in the first step as follows:
SELECT x.Distributor, Name AS Movie, CollectionInMillions, movie_rank
FROM
(
  SELECT Distributor,  Name AS Movie, CollectionInMillions,
  ROW_NUMBER() OVER(PARTITION BY Distributor ORDER BY RevenueInMillions DESC) as movie_rank
  FROM   Movies) x

  JOIN

  (SELECT Distributor, Count(MovieID)
  FROM Movies
  GROUP BY Distributor
  HAVING COUNT(MovieID) > 1
  ) y

  ON x.Distributor = y.Distributor
)
WHERE movie_rank <=2;
Question # 2#
Find the total, average, minimum and maximum of the production budget and revenue earned from the Movies table and append the summary data to the top of the table.
Summary tables provide a quick look into the data when the tables are large or contain a lot of numerical values. Summary statistics include sum, average, maximum, and minimum. Maximum and minimum show the degree of variability of the values in the columns.
We can calculate summary statistics for the BudgetInMillions and CollectionInMillions columns using four separate queries and join the results using UNION clause as follows:
SELECT 'Total' AS Name, SUM(BudgetInMillions) AS BudgetInMillions, SUM(CollectionInMillions) AS CollectionInMillions
FROM Movies

UNION

SELECT 'Average', AVG(BudgetInMillions), AVG(CollectionInMillions) FROM Movies

UNION

SELECT 'Minimum', MIN(BudgetInMillions), MIN(CollectionInMillions) FROM Movies

UNION

SELECT 'Maximum', MAX(BudgetInMillions), MAX(CollectionInMillions) FROM Movies;
If we want the summary stats to appear before the table rows, we can simply join another query to the above using UNION clause:
SELECT 'Total' AS Name, SUM(BudgetInMillions) AS BudgetInMillions, SUM(CollectionInMillions) AS CollectionInMillions
FROM Movies

UNION

SELECT 'Average', AVG(BudgetInMillions),  AVG(CollectionInMillions) FROM Movies

UNION

SELECT 'Minimum', MIN(BudgetInMillions), MIN(CollectionInMillions) FROM Movies

UNION

SELECT 'Maximum', MAX(BudgetInMillions), MAX(CollectionInMillions) FROM Movies

UNION

SELECT Name, BudgetInMillions, CollectionInMillions FROM Movies;
Summary statistics help identify outliers in the data. More summary statistics include standard deviation and variance which show outliers in the data. They can be calculated using the STDEV_SAMP() and VAR_SAMP() function.
Question # 3#
Calculate the mean median and mode of the running time of movies.
Mean, median, and mode are measures of the central value of the data. Mean can be calculated using the AVG() function. For median and mode we need separate queries.
To calculate the median which is the middle value, we first need to number the rows. This will establish if the median is a single value or average of two middle values. We will sort the numbered rows according to the RunningTime.
SELECT @row_num := @row_num + 1 AS rownum, RunningTime
FROM Movies, (SELECT @row_num := 0)x
ORDER BY RunningTime;
Median is the value at the middle row. We will use FLOOR() and CEIL() functions to find the middle rows and take average of the two values to find the median The following query finds the median of the RunningTime column:
SELECT ROUND(AVG(RunningTime),1) As Median
FROM (
      SELECT @row_num := @row_num + 1 as rownum, RunningTime
      FROM Movies, (SELECT @row_num := 0)x
      ORDER BY RunningTime
    )m
WHERE  m.rownum IN( FLOOR( (@row_num+1)/2), CEIL( (@row_num+1)/2) );
The WHERE clause selects one or two rows based on whether the @row_num is odd or even. Our table has 11 rows and the middle row is row 6. To get the correct answer we need to add 1 to the @row_num variable making it 12. Thus FLOOR(@row_num+1/2) will be 6 and CEIL(@row_num+1/2) will also be 6. The WHERE clause evaluates to WHERE m.@row_num IN(6, 6)
In case the number of rows were 10, the median would have been the average of rows 5 and 6. In that scenario, adding 1 to @row_num would give us 11 and FLOOR(@row_num+1/2) would evaluate to 5 while CEIL(@row_num+1/2) would evaluate to 6. The WHERE clause would become WHERE m.@row_num IN(5 ,6)
Mode is the most frequently occurring value in data. It can be calculated by grouping data and then finding the highest occurring value. There can be more than one mode values in data.
Frequency of occurrence can be calculated as:
SELECT RunningTime, Count(*) AS Frequency
FROM Movies
GROUP BY RunningTime
ORDER BY Frequency DESC;
We have two values that occur more frequently than others. To find the highest occurring value/ values in the data, we need a HAVING clause with the above query as follows:
SELECT RunningTime, Count(*) AS Frequency
FROM Movies
GROUP BY RunningTime
HAVING Count(*) >= ALL
   (SELECT Count(*) FROM Movies GROUP BY RunningTime);
Finally by combining the queries for mean, median, and mode we get:
SELECT 'Mean'  AS 'Measure' , ROUND(AVG(RunningTime),1) AS  'Value'
FROM Movies

UNION

SELECT 'Median', ROUND(AVG(RunningTime),1)
FROM (
    SELECT @row_num := @row_num + 1 as rownum, RunningTime
    FROM Movies, (SELECT @row_num := 0)x
    ORDER BY RunningTime
    )m
WHERE  m.rownum IN( FLOOR( (@row_num+1)/2), CEIL( (@row_num+1)/2) )

UNION

SELECT 'Mode', GROUP_CONCAT(RunningTime)
FROM(
           SELECT RunningTime, Count(*) AS Frequency
           FROM Movies
           GROUP BY RunningTime
           HAVING Count(*) >= ALL
                     (SELECT Count(*)    FROM Movies   GROUP BY RunningTime)
  )m;
Question # 4#
Find the correlation between budget, collection and running time of movies and display the results as a table.
To make sense of number columns in a table, correlation is calculated which shows the relationship between two variables. Two variables are said to be correlated if change in value of one variable causes the other to change in a specific manner.
Scatter-plots provide a glimpse of the relationship between two variables. Correlation represents all points on a scatter-plot as a single value which can be between -1 and 1. Correlation has two factors: strength and direction. Strength is how much one variable changes with respect to another. The value of 1 and -1 show a linear relationship meaning that when one variable changes the other also changes on a consistent rate. 0 shows no relationship whatsoever. Values that fall between 0 and 1 or -1 show the strength of the relationship as being weak or strong. The second factor, direction_ of the relationship shows that when one variable increases the other increases or decreases.
Keeping the above discussion in mind, if we view the movie budget and collection values as a scatter-plot, we can spot a linear relationship. However there is no visible relationship between budget and running time of the movie:
By definition Pearson Correlation is expressed as:
Correlation r is calculated using the following formula where:
is the average,
is the standard deviation of x,
n is the count of data pairs:
To calculate the correlation, we need averages of columns and standard deviation of the two columns whose correlation is to be calculated. We will pre-calculate all these parameters to save time on the correlation query:
SELECT @av_budget := AVG(BudgetInMillions),
       @av_collection := AVG(CollectionInMillions),
       @av_time := AVG(RunningTime),
       @stdv_budget := STDDEV_SAMP(BudgetInMillions),
       @stdv_collection := STDDEV_SAMP(CollectionInMillions),
       @stdv_time := STDDEV_SAMP(RunningTime)
FROM Movies;
To calculate the correlation between BudgetInMillions and CollectionInMillions, we will need average values of the two variables, number of occurrences of the second variable (CollectionInMillions) in this case and standard deviation of both variables.
SELECT SUM( ( BudgetInMillions - @av_budget ) * (CollectionInMillions - @av_collection) ) / ((COUNT(BudgetInMillions) -1) * (@stdv_budget * @stdv_collection)) as Correlation
From Movies;
This is a direct translation of the formula shown above. To make the results readable we can encapsulate the above formula in ROUND() function and only show 2 digits after the decimal. Now we will calculate the pairwise correlation and display the results as a table using the UNION clause.
SELECT 'BudgetInMillions' AS Row, 'BudgetInMillions' AS Col,
        ROUND(SUM( ( BudgetInMillions - @av_budget ) * (BudgetInMillions - @av_budget) ) / ((COUNT(BudgetInMillions) -1) * (@stdv_budget * @stdv_budget)),2) AS Correlation
FROM Movies

UNION

SELECT 'BudgetInMillions' AS Row, 'CollectionInMillions' AS Col,
        ROUND( SUM( ( BudgetInMillions - @av_budget ) * (CollectionInMillions - @av_collection) ) / ((COUNT(BudgetInMillions) -1) * (@stdv_budget * @stdv_collection)),2) AS Correlation
FROM Movies

UNION

SELECT 'BudgetInMillions' AS Row, 'RunningTime' AS Col,
        ROUND( SUM( ( BudgetInMillions - @av_budget ) * (RunningTime - @av_time) ) / ((COUNT(BudgetInMillions) -1) * (@stdv_budget * @stdv_time)),2) AS Correlation
FROM Movies

UNION

SELECT 'CollectionInMillions' AS Row, 'BudgetInMillions' AS Col,
        ROUND( SUM( ( CollectionInMillions - @av_collection ) * (BudgetInMillions - @av_budget) ) / ((COUNT(CollectionInMillions) -1) * (@stdv_collection * @stdv_budget)),2) AS Correlation
FROM Movies

UNION

SELECT 'CollectionInMillions' AS Row, 'CollectionInMillions' AS Col,
        ROUND( SUM( ( CollectionInMillions - @av_collection ) * (CollectionInMillions - @av_collection) ) / ((COUNT(CollectionInMillions) -1) * (@stdv_collection * @stdv_collection)),2) AS Correlation
FROM Movies

UNION

SELECT 'CollectionInMillions' AS Row, 'RunningTime' AS Col,
        ROUND( SUM( ( CollectionInMillions - @av_collection ) * (RunningTime - @av_time) ) / ((COUNT(CollectionInMillions) -1) * (@stdv_collection * @stdv_time)),2) AS Correlation
FROM Movies

UNION

SELECT 'RunningTime' AS Row, 'BudgetInMillions' AS Col,
        ROUND( SUM( ( RunningTime - @av_time ) * (BudgetInMillions - @av_budget) ) / ((COUNT(RunningTime) -1) * (@stdv_time * @stdv_budget)),2) AS Correlation
FROM Movies

UNION

SELECT 'RunningTime' AS Row, 'CollectionInMillions' AS Col,
        ROUND( SUM( ( RunningTime - @av_time ) * (CollectionInMillions - @av_collection) ) / ((COUNT(RunningTime) -1) * (@stdv_time * @stdv_collection)),2) AS Correlation
FROM Movies

UNION

SELECT 'RunningTime' AS Row, 'RunningTime' AS Col,
        ROUND( SUM( ( RunningTime - @av_time ) * (RunningTime - @av_time) ) / ((COUNT(RunningTime) -1) * (@stdv_time * @stdv_time)),2) AS Correlation
FROM Movies;
It can be seen that the above query calculates the correlation of a column with the rest of the three columns. For better readability, we can pivot the results with respect to the column value as follows:
SELECT Row,
SUM(CASE WHEN Col='BudgetInMillions' THEN Correlation ELSE 0 END) AS Budget,
SUM(CASE WHEN Col='CollectionInMillions' THEN Correlation ELSE 0 END) AS Collection,
SUM(CASE WHEN Col='RunningTime' THEN Correlation ELSE 0 END) AS RunningTime

FROM (
SELECT 'BudgetInMillions' AS Row, 'BudgetInMillions' AS Col,
        ROUND( SUM( ( BudgetInMillions - @av_budget ) * (BudgetInMillions - @av_budget) ) / ((COUNT(BudgetInMillions) -1) * (@stdv_budget * @stdv_budget)),2) AS Correlation
FROM Movies

UNION

SELECT 'BudgetInMillions' AS Row, 'CollectionInMillions' AS Col,
        ROUND( SUM( ( BudgetInMillions - @av_budget ) * (CollectionInMillions - @av_collection) ) / ((COUNT(BudgetInMillions) -1) * (@stdv_budget * @stdv_collection)),2) AS Correlation
FROM Movies

UNION

SELECT 'BudgetInMillions' AS Row, 'RunningTime' AS Col,
        ROUND( SUM( ( BudgetInMillions - @av_budget ) * (RunningTime - @av_time) ) / ((COUNT(BudgetInMillions) -1) * (@stdv_budget * @stdv_time)),2) AS Correlation
FROM Movies

UNION

SELECT 'CollectionInMillions' AS Row, 'BudgetInMillions' AS Col,
        ROUND( SUM( ( CollectionInMillions - @av_collection ) * (BudgetInMillions - @av_budget) ) / ((COUNT(CollectionInMillions) -1) * (@stdv_collection * @stdv_budget)),2) AS Correlation
FROM Movies

UNION

SELECT 'CollectionInMillions' AS Row, 'CollectionInMillions' AS Col,
        ROUND( SUM( ( CollectionInMillions - @av_collection ) * (CollectionInMillions - @av_collection) ) / ((COUNT(CollectionInMillions) -1) * (@stdv_collection * @stdv_collection)),2) AS Correlation
FROM Movies

UNION

SELECT 'CollectionInMillions' AS Row, 'RunningTime' AS Col,
        ROUND( SUM( ( CollectionInMillions - @av_collection ) * (RunningTime - @av_time) ) / ((COUNT(CollectionInMillions) -1) * (@stdv_collection * @stdv_time)),2) AS Correlation
FROM Movies

UNION

SELECT 'RunningTime' AS Row, 'BudgetInMillions' AS Col,
        ROUND( SUM( ( RunningTime - @av_time ) * (BudgetInMillions - @av_budget) ) / ((COUNT(RunningTime) -1) * (@stdv_time * @stdv_budget)),2) AS Correlation
FROM Movies

UNION

SELECT 'RunningTime' AS Row, 'CollectionInMillions' AS Col,
        ROUND( SUM( ( RunningTime - @av_time ) * (CollectionInMillions - @av_collection) ) / ((COUNT(RunningTime) -1) * (@stdv_time * @stdv_collection)),2) AS Correlation
FROM Movies

UNION

SELECT 'RunningTime' AS Row, 'RunningTime' AS Col,
        ROUND( SUM( ( RunningTime - @av_time ) * (RunningTime - @av_time) ) / ((COUNT(RunningTime) -1) * (@stdv_time * @stdv_time)),2) AS Correlation
FROM Movies
) T
GROUP BY Row
ORDER BY Row;
This table shows that budget and collection have a strong correlation which means that high budget movies have a greater return. However, budget and collection both have a weak correlation with running time.
Question # 5#
Find the market share of top 3 distributors and aggregate the remaining distributors in a single row.
To answer this question, we need to find the total collection of movies by each distributor and select the top 3 rows from the answer.
SELECT Distributor, SUM(CollectionInMillions)
FROM Movies
GROUP BY Distributor
ORDER BY 2 DESC
LIMIT 3;
This query returns the top three distributors according to market share. We can plot the above data as a pie chart:
But this graph does not give a complete picture as it is missing the share of other distributors. To get the whole picture, we need to aggregate the amounts of all other distributors.
This can be achieved by selecting the top three distributors and then UNION the results with distributors not present in the top three. CTE (available in MySQL 8.0) provides an easy way to solve this problem, but in the absence of this feature we can create a temporary table that can be referred in the subsequent query.
CREATE TEMPORARY TABLE T1(
                       SELECT Distributor, SUM(CollectionInMillions)
                       FROM Movies
                       GROUP BY Distributor
                       ORDER BY 2 DESC
                       LIMIT 3);
But we cannot use this temporary table twice in a query like this:
SELECT * FROM T1

UNION

SELECT 'All other' as Distributor, SUM(CollectionInMillions)
FROM Movies
WHERE Distributor NOT IN (SELECT Distributor
                          FROM T1);
The workaround is to duplicate the temporary table and then use two separate tables in the query.
CREATE TEMPORARY TABLE T2
SELECT * FROM T1;

SELECT * FROM T1

UNION

SELECT 'All Others' as Distributor,
       SUM(CollectionInMillions)
FROM Movies
WHERE Distributor NOT IN (SELECT Distributor
                          FROM T2);
Now we have four rows and this gives a holistic view of market share of distributors. The new pie chart along with the previous one is shown to show the difference in market share:
